
VitaraCharts for Strategy: Financial Services
Developer
Vitara
Industry
Financial Services
Description
VitaraCharts for Financial Services is a robust visualization solution that integrates seamlessly with Strategy. Designed to meet the unique needs of financial professionals, VitaraCharts enables organizations to reduce costs, manage risk, enhance customer experiences, and drive revenue growth through intuitive, highly customizable dashboards.
Highlights
VitaraCharts enhances financial services analytics on Strategy with interactive, prebuilt charts designed for KPIs like cost monitoring, risk management, and revenue growth—without any coding. Its point-and-click customization, seamless integration across Strategy Web, mobile, and library, and enterprise-grade security empower teams to build tailored dashboards quickly and securely. Backed by the Vitara team, it streamlines reporting workflows, reduces IT dependency, and ensures scalable, hassle-free deployment.

Unlock the Full Power of AI-BI with Visual Intelligence from VitaraCharts
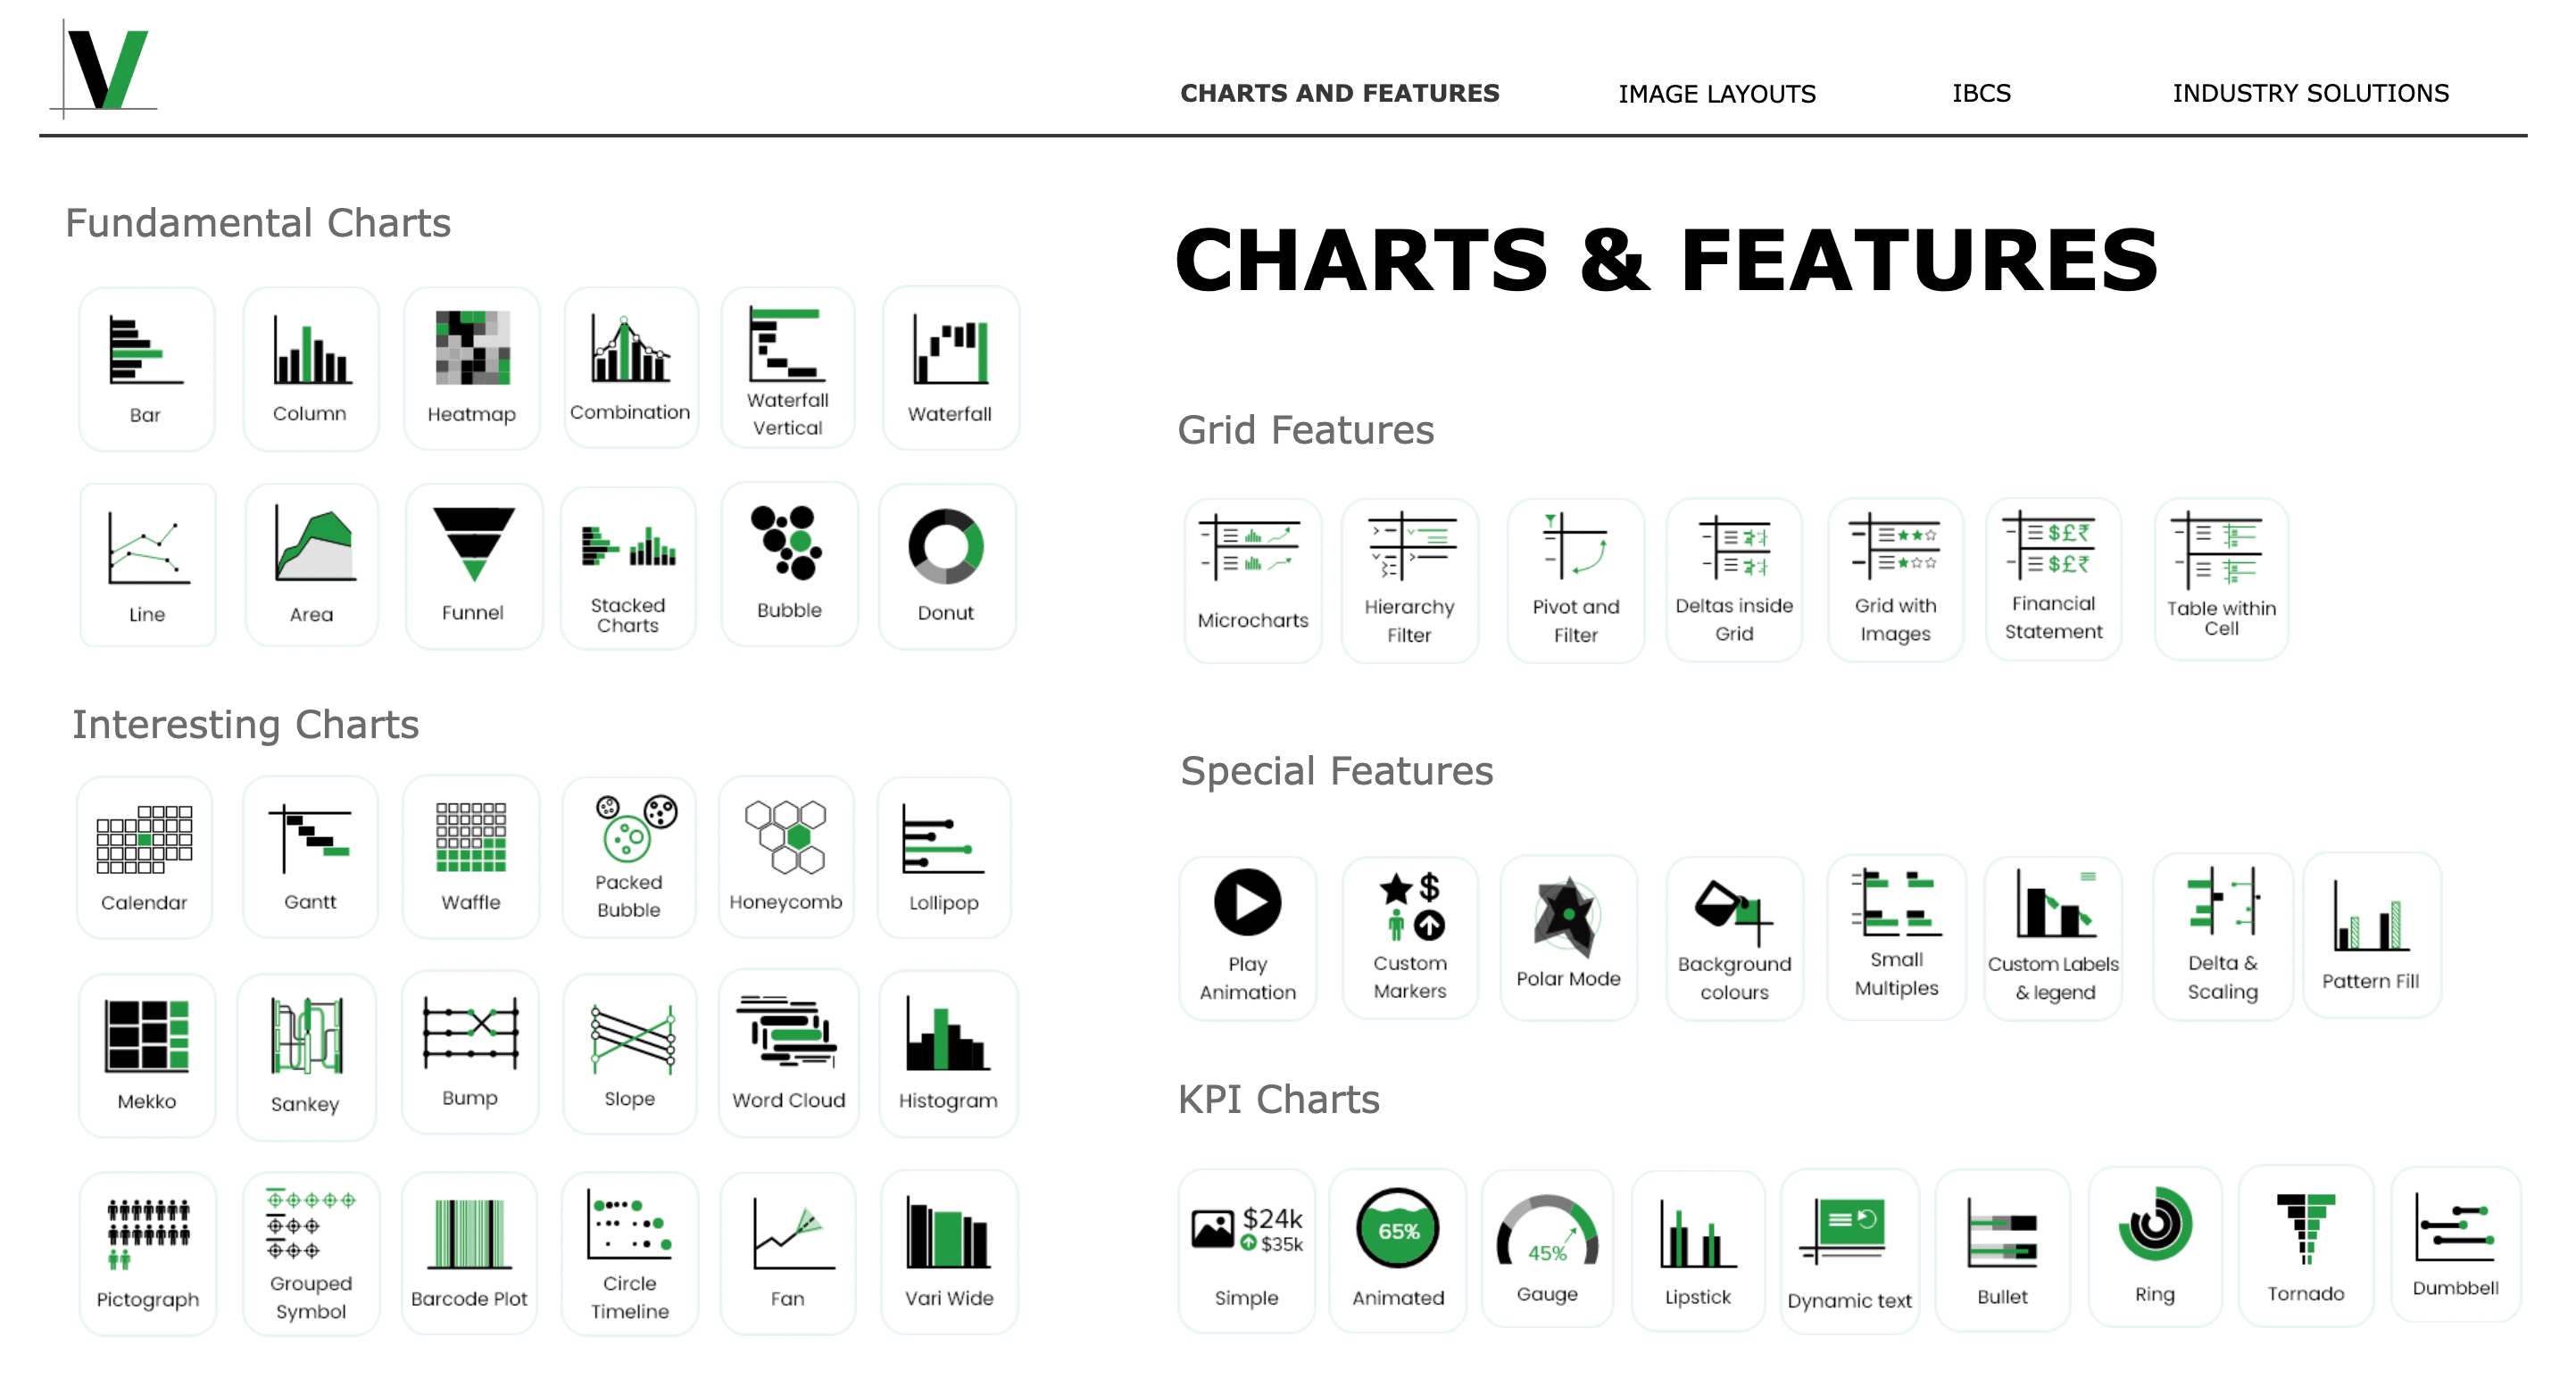
VitaraCharts for Financial Services transforms complex financial data into clear, decision-ready visuals, enabling teams to manage risk, optimize performance, and enhance client retention. With advanced chart options like KPI grids, variance charts, stacked bar charts, and heatmaps, it simplifies reporting for asset management, budgeting, and compliance. Fully integrated with Strategy Web, Mobile, and Library, VitaraCharts enables seamless dashboard creation without coding. Its point-and-click customization empowers financial professionals to track KPIs, visualize revenue growth, and identify cost-saving opportunities with ease. By streamlining workflows and reducing reliance on IT, VitaraCharts accelerates insight generation and operational transparency. Built for the AI-BI era, it delivers engaging visual intelligence that drives smarter decisions across financial services organizations.
Challenges
Organizations embracing AI-powered BI often face gaps between advanced insights and how they’re visually communicated.
1. Visibility of Financial KPIs
Challenge: Financial professionals often struggle to visualize and monitor key metrics, such as ROA, risk exposure, or compliance adherence.
VitaraCharts Solution: Provides 30+ prebuilt, ready-to-use chart types tailored for finance use cases, offering precise visibility into critical KPIs.
2. Reducing Costs and Improving Efficiency
Challenge: Building financial dashboards often requires custom development and IT involvement, increasing costs.
VitaraCharts Solution: Streamlines dashboard creation for business users, eliminating reliance on IT while reducing costs.
3. Customer Retention and Satisfaction Insights
Challenge: Financial institutions need clear visuals to track retention risk, client satisfaction, and revenue trends.
VitaraCharts Solution: Delivers heatmaps, KPI grids, and trendlines that highlight client retention risks and success metrics.
4. Risk and Compliance Management
Challenge: Managing risk exposure and tracking compliance benchmarks can become overwhelming when relying on raw data alone.
VitaraCharts Solution: Enables proactive compliance and risk management with interactive, easy-to-read dashboards.
5. Scalable Visualization Across Teams
Challenge: Maintaining consistent visuals across teams in large financial institutions can be a complex task.
VitaraCharts Solution: Fully compatible across Strategy Web, mobile, and library, VitaraCharts ensures consistency and scalability at enterprise levels.
Unlock Smarter Decisions Through Interactive, No-Code Dashboards
Benefits
Commercial & Business Banking
- Quickly visualize key metrics, such as loan defaults, net interest margins, and return on equity (ROE), with intuitive grids and heatmaps.
- Gain real-time insights on branch performance, customer lifetime value (CLV), and client retention rates to optimize service strategies.
Asset Management & Finance Reporting
Use variance and trend analysis charts to track portfolio performance, asset allocations, and investment returns over time.
Build compliance-ready dashboards that ensure accurate and standardized client reporting, ensuring consistency and reliability.
Accounting & Financial Planning
Visualize cost reduction opportunities, budget adherence, and revenue drivers with waterfall diagrams and bullet charts.
Create standardized dashboards for internal financial statements or audits using IBCS-compliant visuals.
Security and Support You Can Trust
Enterprise-grade security: no external data handling or separate infrastructure.
Managed entirely by the Vitara team—offering hassle-free upgrades, support, and innovation.
Built to scale confidently with Strategy’s enterprise deployments.
Why Financial Institutions Choose VitaraCharts for Strategy
- Direct integration with the Strategy platform ensures plug-and-play visuals that work wherever Strategy works- no dependencies or code required.
- Built for scalability, VitaraCharts delivers consistent and reliable dashboards across teams without compromising security or compliance.
- Simplifies visualization workflows, enabling financial professionals to spend less time building reports and more time making decisions.
